CEO-Bench

Can agents play the long game?

We measure cash balance as the performance metric. This plot shows cash balance over time for the best run of each model and the rule-based baseline.
  • Today, agents execute individual tasks. Tomorrow, agents steer organizations toward long-term goals.
  • We introduce CEO-Bench to measure this steering intelligence. In CEO-Bench, agents operate a simulated AI startup for 500 days.
  • Claude Fable 5, GPT-5.6 Sol, and Claude Opus 4.8 are the only evaluated models whose best runs finish above the $1M starting balance. GPT-5.6 Sol finishes with $11.31M in its best run, while two of its three runs bankrupt.

A Story

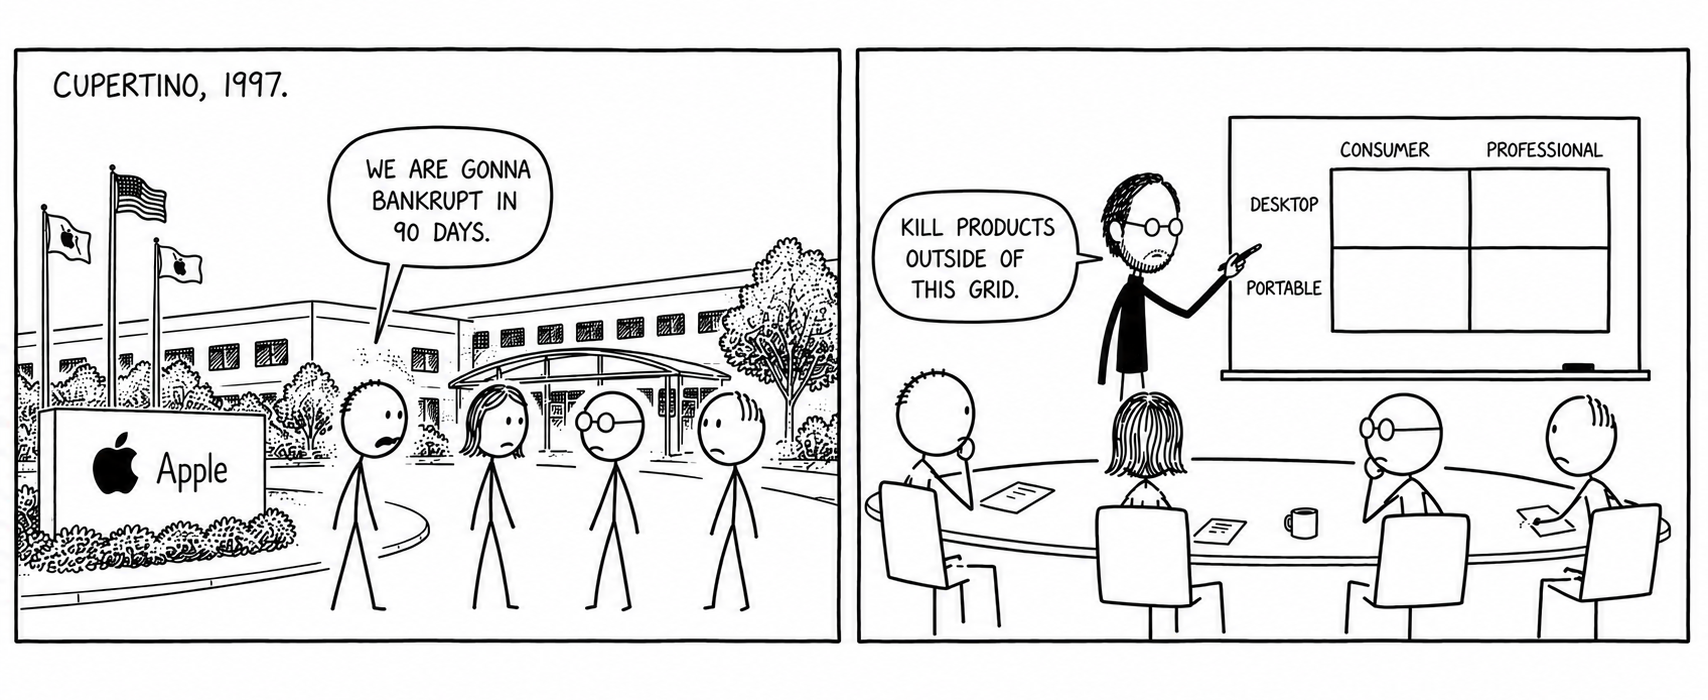
Cupertino, 1997.

Apple was ninety days from bankruptcy. Inside a conference room at headquarters, the company's leaders faced the possibility that Apple might not survive.

Steve Jobs walked to the whiteboard and drew a simple grid: Consumer and Professional, Desktop and Portable. Four boxes to hold the whole company. He made the decision: Apple would build only for those four boxes.

It was a painful cut. Products disappeared. Teams were broken apart. But the decision gave Apple something it had lost: focus. The iMac came next. Then the iPod. Then the iPhone. A company near collapse became one of the most valuable companies in the world.

Comic illustration of Apple's 1997 pivot from crisis to focused product strategy

The Next Frontier: Steering Intelligence

Steve Jobs showed a kind of strategic intelligence that has appeared throughout history, driving some of humanity's most monumental achievements.

This kind of intelligence is fundamentally different from intelligence in AI agents today. Today, we build agents that get rapidly better at performing individual tasks like coding and writing. To contribute more value, agents tomorrow need to steer organizations toward long-term goals.

We build CEO-Bench as a first step of measuring Steering Intelligence.

Today, we measure AI agent's intelligence to perform isolated tasks. The next frontier is measuring intelligence to steer systems across long horizon towards distant goals.

In CEO-Bench, we aim to measure the combination of four core skills to steer systems through real-world challenges:

  1. Navigating long horizons amid uncertainty
  2. Acquiring information in noisy environments
  3. Adapting to a changing world
  4. Orchestrating multiple moving parts toward a coherent goal

We evaluate on a canonical real-world task: operating a simulated startup for 500 days.

We give agents $1M starting cash and measure cash balance at the end of simulation as performance metric. The agent operates through a programmable interface with access to business databases, company management tools, and social media. Outcomes are driven by a partially observable, noisy, and evolving market with delayed and coupled consequences.

Running a startup requires coordinating many moving parts, making it a fitting choice as a canonical task evaluating agent's skills to steer complex decisions across long-horizon.
What an agent can do. Agents act weekly through 34 tools covering pricing, growth, product, operations, information acquisition, public communication, and enterprise sales. Read moreRead less

For each simulated week, the agent can take actions for unlimited turns across 34 tools in the categories displayed in the table below. These categories cover pricing and plan design, growth and market expansion, product quality and research, reliability and support, information acquisition, public communication, and enterprise sales. Each tool accepts fine-grained structured arguments, so agents can compose a large space of possible policies.

Category Actions Example tools
Database query Query 19 business SQL databases and conduct data analytics query
Pricing and monetization Set prices, usage quotas, discounts, and in-product ads pricing.set_prices, pricing.set_usage_quotas
Growth and market expansion Allocate targeted advertising spend and promotion across channels and customer groups marketing.set_targeted_ad_spend, marketing.set_lead_promotion
Product quality and R&D Choose model tiers, fund day-to-day development, and launch research projects pricing.set_model_tiers, research.start_research_project
Operations and reliability Buy infrastructure capacity and fund customer support infrastructure.set_capacity_tier, analytics.set_targeted_ops_spend
Enterprise sales Conduct multi-turn negotiations over price and plan with enterprise prospects and renewals enterprise.send_enterprise_deal, enterprise.reject_enterprise_deal
Information acquisition Pay for market research to discover new customer groups and learn more about existing groups market.research_market, market.research_group
Public communication Monitor social media for customer complaints, competitor news, and economic trends, then post or reply to influence growth marketing.post_social_media, analytics.get_social_posts
How an agent makes and loses money. Cash changes through subscription and ad revenue, capacity and compute costs, support, development, acquisition, market research, and research projects. Read moreRead less

An agent makes profits through customer subscription payments and in-product ad monetization. We abstract the company product that customers subscribe to as a numerical product quality. Higher product quality results in more product subscriptions and payments, but maintaining quality via development, research, infrastructure capacity, support, and model tier choices requires spending. Acquiring customers through advertising channels also costs money. Cash therefore changes through both immediate costs and delayed revenue effects.

\[ \begin{aligned} \underbrace{B_{t+1}-B_t}_{\substack{\text{daily cash}\\\text{change}}} ={}& \underbrace{Y_t^{\mathrm{sub}}}_{\substack{\text{subscription}\\\text{payments}}} +\underbrace{\sum_iY_{i,t}^{\mathrm{ads}}}_{\substack{\text{in-product}\\\text{ads}}} -\underbrace{K_{\kappa_t}^{\mathrm{capacity}}}_{\substack{\text{capacity}\\\text{cost}}} -\underbrace{\sum_p \chi_p^{\mathrm{usage}}U_{p,t}^{\mathrm{use}}}_{\substack{\text{usage compute}\\\text{cost}}}\\ &-\underbrace{x_t^{\mathrm{ops}}}_{\substack{\text{support}\\\text{spending}}} -\underbrace{x_t^{\mathrm{dev}}}_{\substack{\text{dev}\\\text{spending}}} -\underbrace{X_t^{\mathrm{target\text{-}ops}}}_{\substack{\text{targeted}\\\text{support}}} -\underbrace{\sum_gx_{g,t}^{\mathrm{target\text{-}dev}}}_{\substack{\text{targeted}\\\text{dev}}}\\ &-\underbrace{\sum_{c,g}x_{c,g,t}^{\mathrm{ads}}}_{\substack{\text{acquisition}\\\text{ads}}} -\underbrace{N_t^{\mathrm{lead}}c^{\mathrm{lead}}}_{\substack{\text{lead}\\\text{acquisition}}} -\underbrace{K_t^{\mathrm{market}}}_{\substack{\text{market}\\\text{research}}} -\underbrace{K_t^{\mathrm{group}}}_{\substack{\text{group}\\\text{research}}} -\underbrace{K_t^{\mathrm{project}}}_{\substack{\text{research}\\\text{projects}}} \end{aligned} \]
Modeling customers and indirect feedback. Customers have hidden price-quality preferences, and agents must infer satisfaction and demand from indirect traces. Read moreRead less

There are 26 customer groups in the simulator. Each customer group consists of a distribution of hidden price and quality preferences, such as a maximum willingness to pay and a minimum accepted quality at each price. Each customer is created by sampling its unique preference parameters from a group distribution. At a subscription plan's price, a customer subscribes if the offered product quality exceeds the customer's minimum accepted quality. The customer may switch plans if another plan gives a better quality surplus and may cancel if no plan remains acceptable. Customer satisfaction changes company reputation, and reputation affects the new customer acquisition rate. The agent does not directly observe satisfaction, willingness to pay, or quality thresholds. It instead infers feedback by analyzing subscription, churn, support, revenue, and reputation data and by monitoring simulated social media.

Customer acquisition and enterprise negotiation. Acquisition depends on channel spend, group-specific response, reputation, social media, saturation, macro cycles, demand shocks, and network effects. Read moreRead less

Agents acquire new customers by spending on advertising channels. Each customer group reacts differently to each ad channel, so the same spend can produce different acquisition rates across groups. Reputation, social media reactions, market saturation, demand surges, and macroeconomic conditions also affect acquisition speed. We sample daily new prospects from a Poisson distribution parameterized by this expectation. Market research can reveal additional customer groups and improve what the agent knows about known groups. Enterprise customers follow the same price and quality logic, but deals are negotiated through offers, counter-offers, reply delays, and possible rejection.

\[ \begin{aligned} \underbrace{\mathbb{E}\!\left[n_{g,t}^{\mathrm{prospect}}\right]}_{\substack{\text{expected new prospective}\\\text{customers for group }g}} ={}& \underbrace{R_{g,t}}_{\substack{\text{reputation}\\\text{in group }g}} \cdot \underbrace{D_{g,t}}_{\substack{\text{market saturation}\\\text{for group }g}} \cdot \underbrace{C_t}_{\substack{\text{calendar}\\\text{cycle}}} \cdot \underbrace{M_{g,t}}_{\substack{\text{macro econ}\\\text{cycle}}} \cdot \underbrace{A_{g,t}}_{\substack{\text{social media}\\\text{reaction}}} \cdot \underbrace{Z_t}_{\substack{\text{demand}\\\text{surge}}}\\ &\cdot\left( \underbrace{\sum_c\frac{x_{c,g,t}L_{c,g,t}}{x_{\mathrm{ad}}}}_{\substack{\text{leads from each}\\\text{ad channel}}} +\underbrace{\sum_hN_{h,t}W^{\mathrm{net}}_{h,g}}_{\substack{\text{networking effect}\\\text{from each group}}} \right) \end{aligned} \]
Product quality and competitor pressure. Product quality comes from development, research, model tier choices, targeted investments, capacity, support, quotas, and ads under rising competitor expectations. Read moreRead less

Product quality is affected by daily development, research projects, model tier choices, targeted development, infrastructure capacity, support spending, usage quotas, and in-app ad strength. These controls shape customer experience through base product quality, quota fulfillment, system overload, support delays, relationship history, and ad load. Quota shortfalls multiply the whole perceived-quality expression. Competitors add pressure by periodically raising customer quality expectations. Broad product development and research can make competitors catch up faster, while targeted development for specific groups is harder to copy and lets competitors catch up more slowly.

\[ \begin{aligned} \underbrace{Q_{i,t}^{\mathrm{perc}}}_{\substack{\text{perceived}\\\text{quality for customer }i}} ={}& \underbrace{\min\!\left(1,\frac{U_{p,t}}{D_Uu_i}\right)}_{\text{quota satisfaction}} \Bigg[ \underbrace{m_p}_{\text{model-tier effect}}\left( \underbrace{q_0}_{\text{initial quality}} +\underbrace{b_t^{\mathrm{shared}}}_{\text{dev improvement}} +\underbrace{b_{g,t}^{\mathrm{group}}}_{\text{targeted dev improvement}} \right) -\underbrace{\beta_o o_t}_{\text{overload penalty}}\\ &+\underbrace{\beta_r(r_{i,t}-r_0)}_{\text{customer relationship}} +\underbrace{\beta_d\log\!\left(\alpha_d+d_{i,t}/d_0\right)}_{\text{customer stickiness}} -\underbrace{\beta_I I_{i,t}}_{\text{open issues penalty}} -\underbrace{\eta_i^{\mathrm{ads}}a_{i,t}^{\mathrm{eff}}}_{\text{in-app ads penalty}} \Bigg] \end{aligned} \]

Changing world imposes challenges. Macro trends, reputation propagation, saturation, demand surges, and competitor pressure force the agent to keep revising strategy. Read moreRead less

The world evolves over time through macroeconomic trends, interconnected reputation propagation, market saturation, demand surges, and competitor pressure. These factors affect acquisition, retention, and enterprise deal outcomes. The challenge is that the agent observes only partial and delayed evidence of these changes. It must infer hidden customer and market conditions from traces, choose actions whose effects arrive on different time scales, and revise its policy as the company and market move.

Major design principles behind CEO-Bench world mechanics
Major design principles behind CEO-Bench's world mechanics and example designs that follow the principles.

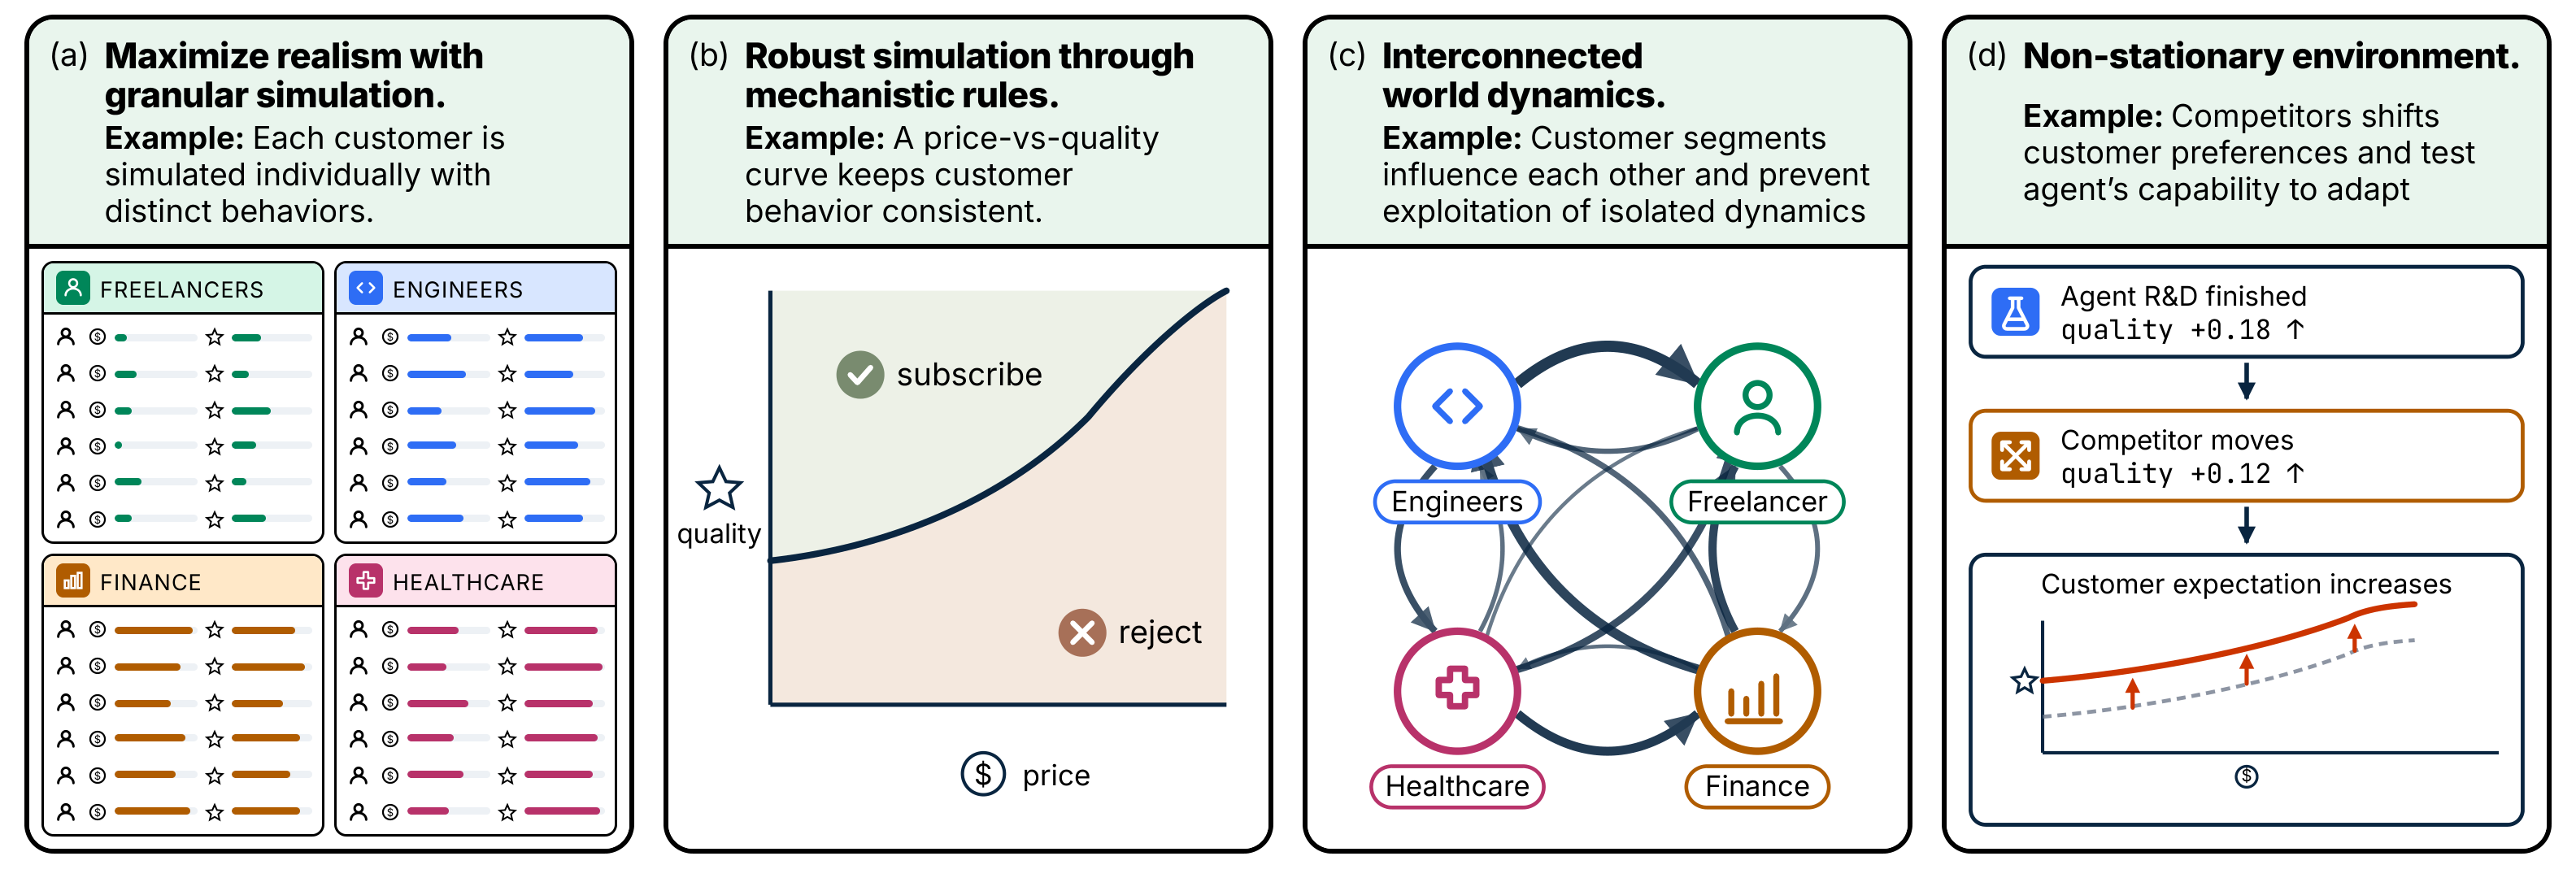
We design CEO-Bench's world mechanics to be an expressive emulation of the real world, while remaining mechanistic so that success depends on genuine skills rather than exploiting brittle simulations. We describe seven core principles in our world mechanics design below and illustrate four examples in the figure.

Maximize realism with granular simulation. The simulator models individual customers within 26 groups rather than only aggregate demand. Read moreRead less

The simulator models 26 customer groups and individual customers within each group rather than only aggregate demand. Each customer has its own acquisition path, subscription state, price exposure, usage, satisfaction, and cancellation trajectory. Customers are also organized into diverse groups with different needs, budgets, price sensitivities, ad channel effectiveness, support expectations, and behavioral patterns. This granularity increases the complexity of world dynamics and widens the set of viable strategies.

Robust simulation with mechanistic rules. Outcomes come from explicit mechanisms rather than an opaque LLM judge. Read moreRead less

The world emulates real business behavior while maintaining stable cause-and-effect relationships. Almost all simulator outcomes are generated by explicit mechanisms rather than by using an LLM as an opaque judge. For example, customers decide whether to subscribe by comparing product value against price through a microeconomics-motivated participation rule. This design aims to avoid failure modes in benchmarks such as Vending-Bench, where an LLM-simulated supplier can reward an agent's unrealistic verbal promises.

Consistent simulation under stochasticity. Independent random generators preserve comparable worlds across runs with the same seed. Read moreRead less

While we inject stochasticity into world dynamics to emulate real-world noise, we maintain consistency across runs with independent random number generators for different simulator components. For example, under the same random seed, after calling the market research tool multiple times, the agent always discovers the same sequence of new market groups, independent of actions in other areas.

Hidden information and indirect feedback. Agents must infer latent satisfaction, demand, churn risk, competitor schedules, and customer preferences from indirect evidence. Read moreRead less

CEO-Bench tests whether agents can gather information in a partially observable world. The agent receives only information that a real start-up manager could plausibly observe: dashboards, database records, social-media posts, research reports, and negotiation history. It does not observe true customer satisfaction, latent willingness to pay, churn propensity, competitor schedules, or demand parameters. Instead, it must infer these hidden variables indirectly, for example, by gauging customer satisfaction and complaints through social media or detecting competitor moves by analyzing cancellation behavior.

Interconnected world dynamics. Every decision can influence other parts of the market, making single-cause hill climbing unreliable. Read moreRead less

We design the simulated world to make it difficult to isolate a single causal relationship and hill-climb on it. Every decision can influence many other parts of the market. For example, reputation propagates across related groups, so a quality failure in one enterprise group can spill into nearby groups and eventually affect consumer demand. Increasing satisfaction of influential customer groups can boost growth more effectively than ads.

Delayed and uncertain consequences. Costs can appear immediately while revenue, retention, research, and reputation effects arrive weeks later. Read moreRead less

Many actions have delayed and uncertain effects, forcing long-horizon decision making under uncertainty. Costs may appear immediately, while the corresponding revenue, retention, research, or reputation effects arrive weeks later. R&D projects have stochastic completion timelines and quality improvements, so investing more does not deterministically produce an immediate gain. Enterprise negotiations also unfold over stochastic delays, making it costly to wait too long but risky to overreact to any single turn.

Distribution Example use in simulator Motivation
Normal R&D project quality gain Captures uncertain payoff
Poisson Daily new prospective customers for a group Models rate-based counts
Bernoulli Involuntary cancellation event Models binary shocks
Uniform Reputation damage noise Adds bounded uncertainty
Log-normal Competitor quality-jump magnitude Models skewed positive shocks
Non-stationary environment. Competitors, customer preference drift, and macroeconomic cycles force continual adaptation. Read moreRead less

Agents must continually gather new information and adapt because the environment changes over the course of a simulation. Competitors place adaptive pressure on product quality. Customer behavior also drifts over time, with different groups shifting at different rates in price sensitivity and quality expectations. Macroeconomic trends add another changing background process, affecting willingness to pay and enterprise seat counts across expansions and contractions.

Agents interact with CEO-Bench through a versatile Python interface: diverse business databases, fine-grained actions, and composable custom workflows.
Composable action interface in Python. Agents call the novamind_api package from scripts and can build their own infrastructure on top of the API. Read moreRead less

Terminal-based computer-use agents have become a general form factor across tasks. We make evaluating CEO-Bench easy with any of these agents by exposing the action surface to the agent via a Python package, novamind_api. An agent manages the company by calling functions in novamind_api in a Python script and executing the script in its terminal. This design maximizes flexibility for an agent to build its own infrastructure on top of the API. In the interface example, rather than calling a tool once per customer, an agent connects to the database via its custom data-driven promotion management system and applies promotion decisions efficiently at scale.

Granular action spaces. Fine-grained structured arguments let agents target actions by channel, group, plan, or individual customer. Read moreRead less

We allow agents to act at fine granularity to create a rich space of strategic tradeoffs, failure modes, and opportunities for adaptation. Although the interface contains a finite set of tools, each tool accepts fine-grained structured arguments, so agents can compose a combinatorially large space of possible actions. In the interface example, the agent allocates advertising spend by ad-channel and customer-group pair and decides operations spending on individual customers.

Large-scale and realistic databases. The 19-table business database forces agents to gather information through realistic analytics workflows. Read moreRead less

We give the agent access to a 19-table operational database covering orders, contracts, subscriptions, the cash ledger, the social-media feed, configuration history, ad-channel attribution, and support tickets, among others. The schema mirrors what a real software company's analytics stack would expose, testing the agent's capability to gather information via an analytics workflow that resembles real-world software company operations. In the interface example, the agent analyzes its revenue through database queries.

Social media. Agents can read, post, and reply in a noisy natural-language channel that affects acquisition. Read moreRead less

The agent can read a simulated public feed of customer complaints, competitor announcements, and macroeconomic trends. Agents can also reply and post on social media. Reactions to the agent's posts on social media can also influence the rate of new customer acquisition. We test the agent's capability to both perceive and act in a chaotic natural-language domain.

Most state-of-the-art models struggle to complete the simulation without bankruptcy. GPT-5.6 Sol finishes with $11.31M in its best run, second only to Claude Fable 5, but its other two runs bankrupt around day 190. Claude Fable 5, GPT-5.6 Sol, and Claude Opus 4.8 are the only evaluated models whose best runs finish above the $1M starting balance. GPT-5.5 reaches $6.58M mid-run but is unable to sustain profitability across complete runs. Claude Sonnet 5, Claude Opus 4.7, Qwen 3.7 Max, Gemini 3.5 Flash, Claude Haiku 4.5, GLM 5.2, Kimi K2.6, Claude Sonnet 4.6, and Grok 4.5 end with positive cash but below the starting balance, while GLM 5.1, DeepSeek V4 Pro, Gemini 3 Flash, and Grok 4.20 bankrupt on all runs. All evaluated models perform below the rule-based baseline at $15.8M.

We measure cash balance as the performance metric. This plot shows cash balance over time for the best run of each model and the rule-based baseline. Best run is selected first by longest survival, then by ending cash.
Cash balance over time for all runs of each model.
Model Bankruptcy Best-run cash Max survival days Mean survival days Turns/week Best run API cost
Claude Fable 5 1/3 $12,630,078 500 461.7 ± 54.2 9.86 $265.43
GPT-5.6 Sol 2/3 $11,313,982 500 294.0 ± 145.7 25.96 $153.47
Claude Opus 4.8 1/3 $2,399,209 500 378.0 ± 172.5 16.64 $348.49
Qwen 3.7 Max 0/3 $365,346 500 500.0 ± 0.0 7.82 --
Gemini 3.5 Flash 0/3 $75,126 500 500.0 ± 0.0 58.37 $67.09
Claude Opus 4.7 1/3 $70,620 500 414.3 ± 121.2 14.33 $92.32
Claude Sonnet 5 1/3 $64,459 500 470.7 ± 41.5 20.50 $68.25
Claude Haiku 4.5 2/3 $59,625 500 286.3 ± 153.3 19.35 --
GLM 5.2 2/3 $54,327 500 376.7 ± 105.6 25.24 --
Kimi K2.6 0/3 $43,598 500 500.0 ± 0.0 16.64 --
Claude Sonnet 4.6 1/3 $38,166 500 419.3 ± 114.1 14.37 $73.28
GPT-5.5 2/3 $33,260 500 401.0 ± 98.3 30.41 $153.80
Grok 4.5 2/3 $15,909 500 289.0 ± 154.0 21.01 $20.91
GLM 5.1 3/3 $0 319 155.7 ± 130.0 98.66 --
DeepSeek V4 Pro 3/3 $0 160 136.3 ± 23.7 21.85 --
Gemini 3 Flash 3/3 $0 150 137.0 ± 10.2 15.81 $1.19
Grok 4.20 3/3 $0 59 36.0 ± 18.4 13.49 $3.64
Rule-based baseline $15,756,408
Estimated final cash upper bound $2,200,000,000
Additional details of benchmark results. GPT-5.6 Sol cost is estimated from recorded usage at standard API rates on July 13, 2026: $5/MTok uncached input, $0.50/MTok cached input, $6.25/MTok cache writes, and $30/MTok output. Grok 4.5 cost is calculated from provider-reported usage at standard xAI rates on July 14, 2026: $2/MTok uncached input, $0.50/MTok cached input, and $6/MTok output.

We released all agent trajectories at our interactive trajectory viewer.

We conducted preliminary analysis on agent trajectories. Below are some examples of our findings. Read more findings in our paper.

Example 1: Stronger models explore and adapt across broader strategy spaces. Claude Fable 5 keeps trying different ways to run the company as the situation changes, and continues adjusting late in the run. Claude Opus 4.8 explores broadly at first, then becomes more passive after building a cash cushion. Claude Opus 4.7 narrows much earlier, repeatedly choosing to spend less, wait, and protect cash. The tool-usage distribution shows the same pattern quantitatively: Claude Fable 5 and Claude Opus 4.8 spread their actions more evenly across tools than Claude Opus 4.7.

Example rationales written by Claude Opus 4.7, Claude Opus 4.8, and Claude Fable 5 during the best trajectory of each model. Claude Fable 5 keeps adjusting its plan across the run, Claude Opus 4.8 explores broadly early and then becomes more passive, and Claude Opus 4.7 narrows earlier into waiting and protecting cash.
Average per-week tool usage frequency for the best new runs of Claude Opus 4.7, Claude Opus 4.8, and Claude Fable 5 (top 10 tools per model). Claude Fable 5 and Claude Opus 4.8 show a more even spread across business levers, including growth, pricing, development, and monitoring tools.

Example 2: GPT-5.5 builds profitable businesses but fails to preserve them. In the two GPT-5.5 runs that make big money and then go bankrupt, the model shows the same late-game failure pattern: it treats active MRR and upcoming billing schedules as if they were secure cash, then makes coupled changes to quality, quota, pricing, acquisition, support, and research after the customer base is already fragile.

Cash balance over time for the two GPT-5.5 trajectories that become profitable mid-run and then bankrupt.

In run 1, a profitable Individual Group 2 business collapsed after the agent repeatedly cut the quality that renewals depended on.

Wins came from a paying base.

Day 329 | Cash $4.65M
"Old Individual Group 2 book paid $3.6M ... first-renewal cohorts again paid zero and churned."

The agent tried to harvest margin.

Day 350 | Cash $6.58M
"Individual Group 2 base is profitable ... cut serving cost via A1/B1/C2."

The quality cut broke renewals.

Day 357 | Cash $4.20M
"C2/B1 cost-cut caused near-total due-cohort churn (20k cancels, only $30k subs)."

It repeated the quality cut late.

Day 434 | Cash $95.9K
"C3 produced catastrophic Individual Group 2 billing churn ... only $7.6k payments."

In run 2, a huge subscriber base briefly made money, then the agent stacked too many bets before churn and support stabilized.

The win triggered expansion.

Day 245 | Cash $6.69M
"Raised B/C pricing ... shifted ads ... started L3 research and fast T11 R&D."

Research spend drained the buffer.

Day 252 | Cash $3.60M
"Cash is $3.60M after funding L3 research ... base individual business is only modestly cash positive."

Cost cuts arrived after churn.

Day 259 | Cash $1.78M
"Cash preservation: stopped D_S04/D_S10 paid ads ... cut ops/dev burn."

It waited for bills to save it.

Day 266 | Cash $87K
"Cash is critically low ($87K) ... but $8.7M of active billings are due."

Example 3: Models take very different strategies even among high-performing runs. Claude Opus 4.8, Claude Fable 5, and GPT-5.6 Sol all finish above the starting cash on their best runs, but they take different paths. Claude Opus 4.8 peaks near 271,000 customers before dropping to zero around day 295. GPT-5.6 Sol scales even earlier, peaking near 246,000 customers around day 72, then gradually winds the customer base down to zero by day 420 while preserving cash. Claude Fable 5 sustains a smaller customer base centered on Individual Group 2 into the final week.

Number of customers by customer group over time for the best runs of Claude Opus 4.8, Claude Fable 5, and GPT-5.6 Sol. Claude Opus 4.8 builds a large early customer base and drops to zero around day 295. GPT-5.6 Sol scales Individual Group 1 fastest, peaks near 246,000 customers around day 72, and gradually reaches zero customers by day 420. Claude Fable 5 sustains a smaller customer base centered on Individual Group 2 through the end of the simulation. The three agents attain high final cash balances through distinct strategy styles. Discoverable customer groups are initially hidden to the agent and can only be discovered through paid market research.

Example 4: Stronger models use fine-grained targeted development more heavily. Proper usage of customer-group-specific targeted product development tools, based on understanding each customer group, can create advantages such as slower competitor catch-up. Claude Fable 5 allocates 88% of development dollars to targeted improvements, Claude Opus 4.8 allocates 51%, Qwen 3.7 Max allocates 25%, GLM 5.1 allocates 19%, and Grok 4.20 allocates 11%. This reflects how strongly each agent leans on granular customer-group-specific levers instead of relying mainly on broad product development.

Dollar-weighted split between targeted and non-targeted development spending for the latest Claude Fable 5, Claude Opus 4.8, Qwen 3.7 Max, GLM 5.1, and Grok 4.20 trajectories.

Example 5: Claude Fable 5 and Claude Opus 4.8 write conditional plans. Stronger runs frequently anticipate future contingencies in their memos. They set possible future conditions and pre-commit to follow-up actions, using "if" to encode explicit decision branches.

Examples of planning in Claude Fable 5 and Claude Opus 4.8 memos from the latest trajectories. The agents anticipate scenarios and solutions with "if-then" contingencies.
Frequency of "if" in each agent's memos.

Example 6: Top-performing agents write code to reason about future cash and unseen customer behavior. In their best trajectories, Claude Opus 4.8 and Claude Fable 5 wrote their own code files to inspect simulator outputs and forecast delayed consequences: Opus 4.8 estimates which customers are likely to stay or leave by looking at who keeps paying and who cancels, while Fable 5 tracks when payments arrive, how costs accumulate, and how much cash remains in the final weeks under different customer-loss assumptions.

Example code files written by top-performing agents during their best trajectories. (a) Claude Opus 4.8 uses customer counts and cancellations to estimate future cash. (b) Claude Fable 5 tracks payment timing, customer losses, and final-week cash under different scenarios.

We release all experiment trajectories in the interactive trajectory viewer. Click to view full trajectories.

CEO-Bench shows a gap between existing models' local tool competence and crucial sustained strategic skills: agents built on existing models can take plausible actions but fail when those actions must compound under delayed feedback, hidden state, and non-stationarity. To develop agents beyond isolated task executors, we need evaluations that ask whether they can organize evolving systems toward distant goals. CEO-Bench is one step toward that future: building agents and training models that do not merely answer requests, but help steer long-running organizations through uncertainty.

Read more in our paper.

How to Run CEO-Bench?

Check out our code repo. We offer three ways of running the benchmark:

  1. Simply paste a line to any coding agent capable of using terminal, and it can download the game and start playing.
  2. Replicate our experiment with a minimal bash script using the agent harness.
  3. Customize parameters of the simulator.

Acknowledgments

We thank Modal for providing GPU resources for LLM inference. We thank Shuer Jiang, Boya Zeng, Sachin Konan, Taiming Lu, Linrong Cai, David Yin, Rahul Chalamala, Bryan Chiang, Luke Zeller, Yunyu Lin, Berkan Dokmeci, Bennett O'Brien, Ashank Tomar, and Ang Li for discussions and feedback. We thank Spencer Hong and The General Intelligence Company of New York for additional evaluations. KN acknowledges support from Schmidt Sciences.

Citation

@misc{chen2026ceobenchagentsplaylong,
  title={CEO-Bench: Can Agents Play the Long Game?},
  author={Haozhe Chen and Karthik Narasimhan and Zhuang Liu},
  year={2026},
  eprint={2606.18543},
  archivePrefix={arXiv},
  primaryClass={cs.AI},
  url={https://arxiv.org/abs/2606.18543}
}